How to Read Google Ads Reports?

Reports are an integral part of every activity. However, sometimes it may be hard to comprehend the content of the documents, especially if they concern operations in a narrow and specialized area such as Google Ads. Want to find out how to read Google ads reports so that they make sense and are of use to you? Keep reading!
It’s difficult to plan and determine the path your company will take if you don’t draw conclusions from its previous activities. Regular reports that can be helpful in making strategic decisions are a natural part of work of every SEO/SEM agency. See how to read Google Ads reports and what to expect from them.
Why Google Ads reports are a must?
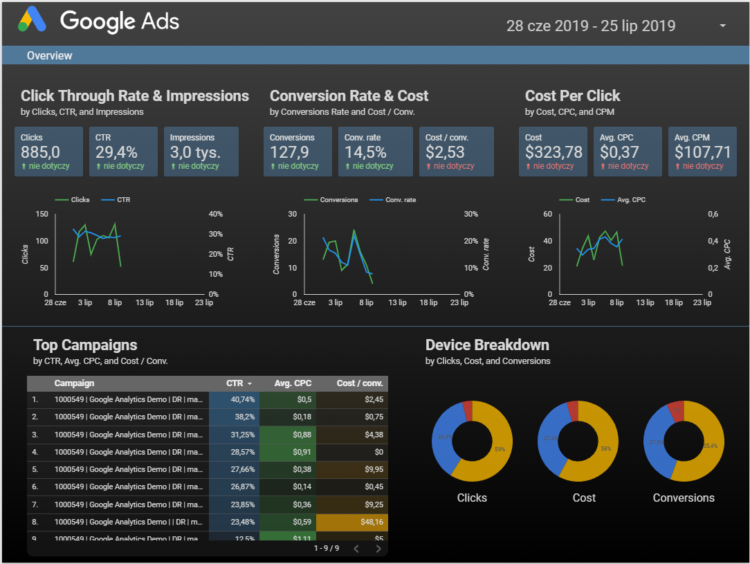
The very basic and important purpose of the reports presented to clients is to outline the results of the campaign and explain what the Google Ads budget was spent on. In Delante, such reports are sent once a month, however, it’s possible to generate them more frequently, for example once a week. Reports created in Google Data Studio are characterized by the comprehensiveness of the data. You can find there key performance indicators such as clicks, impressions, CTR, CPC, CPM and costs of the campaign or conversion. The abovementioned factors will be discussed in detail later on in the article.
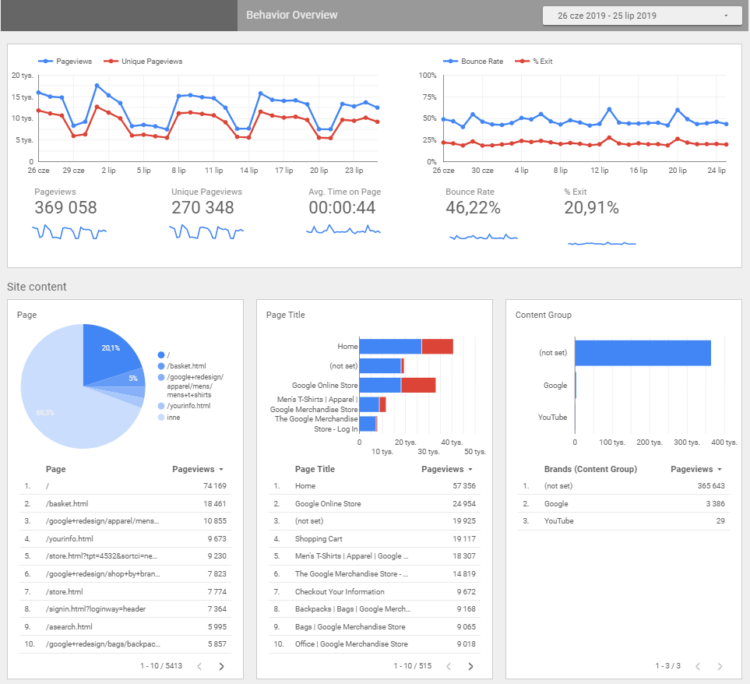
Google Ads reports are also generated by marketing and sales departments to analyze data. It’s an excellent way to graphically represent the data collected by other tools such as Google Analytics. The data presented legibly in the graphs allow you to draw insights and on their basis you can evaluate the effectiveness of your activities. Moreover, a thoroughly prepared report supports other areas of work, for example:
- As the report is tailored to the objectives of the campaign, it enables you to establish which campaigns are effective in a given time and thanks to that you can plan your campaigns in accordance with the time periods which are the most beneficial;
- It facilitates planning the marketing funnel (to whom and when target your advertisements, what type of campaign to choose?);
- It helps in assigning responsibilities and tasks within the team;
- It’s a reliable basis for periodic evaluation of the agency;
- Thanks to the information on how the work on the account is distributed (optimization, account extension, advertising tests and others) and how long a given activity takes, it’s helpful in achieving top quality standard of the service. Consequently, you get the guidelines telling you what to focus on to improve your results.
The report from Delante provides you with conclusions to the report in writing, a very detailed data list in both PDF and electronic formats.
For more information on how to connect Google Ads reports to Google Data Studio, go to the Data Studio Support article.
10 reasons proving that Google Data Studio is an innovative solution
The most useful tools are those able to solve your problems comprehensively from A to Z and those that are handy, flexible and free of charge. This is a perfect outline of possibilities provided by Google Data Studio. It’s worth mentioning that Delante implements this tool for its clients, therefore they can access it any time they wish – from the moment they start using it till their resignation from Google Data Studio. The client, not Delante, is the owner of the report, thus the quality of the reports stays at the same high level, regardless of the cooperation. Moreover, among the most valuable advantages of GDS we need to mention:
- The adjustability of the report to the client’s needs. It’s possible to expand the report with any extra data or graphs illustrating them (using sources different than Google Analytics or Google Ads). The options of presentations are limited solely by creativity.
- The possibility to analyze the results of the campaign whenever and wherever you want. Reports generated in Google Data Studio load very quickly and use small data transfer which can be a huge advantage when you want to analyze the effectiveness of your activities when you’re, for example, on a vacation abroad.
- Using the collected customer data for other marketing activities. The client can use the gathered data to build persona or optimize activities on other marketing channels.
- Using the collected data to optimize the landing page. The data concerning user behavior on the website can be used to optimize UX/UI.
- Selecting the optimal ROAS/ROI indicators on the basis of data concerning costs and revenues as well as calculating the ideal indicator based on marginal costs.
- A quick analysis of tests and experiments carried out on the account. You’re able to track the effects of tests of graphic or text advertisements on an ongoing basis, as you can freely change the scope of graphic data presentation from connected sources.
- Comparison of historical data and straightforward presentation of changes over time. Possibility of incorporating trends.
- The possibility to import any external data, for example the data from CRM systems.
- The possibility to combine different data sources, for example data from Google Analytics, Google Ads or CRM.
- The possibility to easily share the document with other people. Moreover, you can download the report as a PDF file and save it wherever you wish.
Reports generated in Google Data Studio – what do they look like?
There is no one ready report template in Google Data Studio that we could use. Our clients operate in completely different industries, they’ve various expectations, objectives and different ideas on how to achieve their goals. Therefore, this article won’t include a recipe for success or a scheme ready to use. However, all the reports have something in common – clear graphs and numbers illustrating the results – a simple formula for a comprehensible report.


And last but not least – we provide each of the reports with valuable conclusions and comments.
CTR, ROAS, CPC…what are they and how to interpret them?
When you receive a report of activities in Google Ads, you always come across a few terms that are essential to describe and analyze the results. SEO specialists use them to precisely define the increases, outline any declines or explain what the money was spent on. Now, we’re going to introduce you to several definitions and give you some examples as to why the data in the report may change:
Impressions
It’s simply the number determining how many times the advertisement in Google has been shown to a user. One impression is counted every time Google shows your advertisement to a user.
Clicks
They’re counted every time a user clicks on the advertisement. This indicator assesses how attractive the ad is for people who watch it. Clicks are counted even if your website displays as unavailable.
Costs
Meaning the information on how much was spent on the Google Ads campaign. For more details concerning payments in Google Ads, go to our previous article. Note that the costs included in the report concern the amount of money spent on advertising, not on the support of your Google Ads account.
CTR (Click Through Rate)
It’s expressed in the form of a percentage and it determines how often users clicked on the advertisement that was displayed to them. This is a very useful indicator assessing the effectiveness of both keywords and advertisements.
If you want to calculate your CTR by yourself, you’ll need to divide the number of clicks by the number of impressions and multiply the result by 100%. Just to put you in the picture: if the advertisement generated 150 clicks per 1000 impressions, the CTR equals 15% [(150/1000)*100 %].
The high click-through rate suggests that the selected keywords are properly linked to the advertisement and users click on the advertisement because it corresponds to their search queries.
However, if your CTR is low or lower compared to the previous result, don’t panic. It may be a consequence of numerous factors (that might be improved) or of advertising tests. Such ads will always include the ones that perfectly suit the user’s needs and the ones that are totally useless from the recipient’s point of view.
Remember that it’s impossible to establish a CTR level that would be beneficial for all kinds of campaigns. Your CTR is affected by a great number of factors such as industry, campaign objectives, offered products or services, seasonality, advertising content or the target group. If you want to find out what CTR would be satisfactory in your case, we’d suggest a comparative evaluation in similar conditions. So where to find information about it? Obviously in the report 😉
The Search Network campaigns usually generate the highest CTR – the result above 10% can be considered as satisfactory. Due to the specification of the campaign format, Product Listing Ads generate lower CTR (reaching approximately 5%) and in this particular case, the price of the product has a significant influence on the increase of the CTR. On the other hand, the campaigns in Google Display Network achieve the lowest click through rates, especially when it comes to building the range of advertisements and setting the CPM rate. It often happens that CTR of the banner ads is lower than 1% and the result above 1% can be considered a success. Obviously, in each case everything depends on your strategy.
CPC (Cost Per Click)
CPC is simply cost per click. You’ll come across this indicator when creating a campaign with specific CPC rates. Then, you need to set the maximum CPC bid, meaning the highest amount you’re willing to pay for one click.
It’s worth noting that not every click on the advertisement will cost the maximum CPC bid. Very often the price is notably lower because during the auction you need to pay minimum of the maximum amount essential to keep the advertisements on the top positions.
Remember that CPC is influenced by numerous factors such as popularity of a given phrase or seasonality (for example, during Christmas the phrase “gift wrapping paper” will be more expensive than during summer months). It’s all due to the fact that many advertisers want to be displayed on a particular phrase, therefore, the competition is very big.
CPM (Cost per Mille)
Otherwise known as the cost of a thousand impressions. The information included in the CPM report most often concerns the Google Display Network and shows how much you need to pay to reach 1000 users. This indicator is particularly important in building brand awareness and reach. Bear in mind that its value is higher in the case of detailed targeting of recipients or in the case of competitive markets.
Conversions (what are they and what are their types?)
Conversion is an action undertaken by a user after interacting with the advertisement. Users can either purchase your products, make a phone call, download an e-book or subscribe to a newsletter. In simple words, it’s about all the actions that the advertiser concerns valuable for the company and wants to count.
CPA = total cost of the campaign/number of clicks
Inclusion of demographic data in the report
Demographic data provide information about age, gender, the device used by the client or the location of the users. On the basis of browsed websites and online purchases, the data can also suggest you the phrases and interests of the users. Including these data in the report is important when it comes to creating advertising content, campaign management or remarketing.
ROAS (Return On Advertising Spend)
This indicator is necessary if you want to establish the return on advertising spend.
So, for example, you want your conversion (e.g. sales value) to be 10 USD for every 2 USD spent on advertising. Then, you set ROAS 500%, that is:
(10 USD from conversion / 2 USD of advertising expenses)*100% = 500% of the target ROAS.
ROAS should be as high as possible, however, remember about the economy of scale and the fact that increasing your ROAS constantly may result in a decrease in revenue. Most often – together with the client – we define the target and minimum ROAS and later the report outlines whether we’re heading in the right direction.
ROI (Return On Investment)
It’s a return on investment calculated when all expenses have been taken into account. Here is an example:
On your offer you have a product that costs 150 USD. The production costs 60 USD and thanks to Google Ads you were able to sell 5 pieces.
You spent 40 USD on advertisements in Google Ads.
The revenue is: 5 pieces x 150 USD = 750 USD.
The cost of production: 5 pieces x 60 USD = 300 USD.
The cost of advertisements in Google Ads: 40 USD.
Return on this particular investment amounts to: [(750 USD – (300 USD + 40 USD)/(300 USD + 40 USD)]*100% = 120 %.
Monitoring your conversion is necessary to calculate ROI. We’d recommend using Google Analytics and integrating it with the Google Ads platform. We’re also fully aware that sometimes it’s difficult to differentiate ROAS and ROI, therefore, if you want to find out more, go to our article discussing ROAS and ROI in Google Ads campaigns. ROI is calculated on the basis of the data provided by the client and concerning other costs or margins. On the other end of the spectrum, ROAS is calculated based solely on the revenues and costs of the campaign. ROI is much more accurate, however, it’s difficult to report it.
To sum up
If you’re searching for a tool that presents data outlining the results of Google Ads campaigns in a comprehensible way, check Google Data Studio. The implementation of this tool will take you to the higher level of reporting and analyzing your performance indicators will become more enjoyable than ever before. On one page of the report we provide clear data tailored to the individual needs and preferences of the client.
Reports aren’t only about numbers. Properly described information is a valuable guideline suggesting the next steps that might be taken by the company in the areas such as investments or marketing. We hope that our little crib notes discussing the key indicators of Google Ads campaigns will make your work with Google Data Studio a real pleasure.


