How to Use Google Analytics for Marketing and SEO?

If you run a website, perhaps you already benefit from statistics provided by Google Analytics, the most popular tool of this kind in the world. It’s worth getting befriended with GA as it can provide you with a lot of valuable data thanks to which you’ll be able to evaluate the effectiveness of your SEO campaign or marketing activities. Check out what information you can obtain using Google Analytics.
Table of Contents:
- How To Analyze SEO and Marketing Activities In Google Analytics?
- Who are your recipients?
- How do users reach your website?
- What subpages are left without any action?
- What’s your conversion customer journey map?
- What subpages are usually visited as the first ones?
- What do users search for on your website?
- What social media campaigns generated the greatest traffic?
- What CTA is the most effective?
Google made Analytics services available for free in 2005. Since then, the functionality of this tool has been continuously developed and consequently, today it helps you obtain even more information about your website visitors.
Google Analytics is undoubtedly the most popular solution of this type in the world. According to w3techs.com data, it’s used by more than half of analyzed websites, and if we take into account only these pages that use analytical tools, the share of GA reaches 90%. Of course, these numbers aren’t a coincidence. The tool is a source of information about user behavior, based on which you can analyze the effectiveness of marketing activities or individual sources of traffic.
It’s worth getting to know GA closer. In today’s entry, we’ll show you its functionalities, types of information it can give you, and ways to use it to your advantage.
How To Analyze SEO and Marketing Activities in Google Analytics?
Google Analytics provides users with many features allowing them to analyze the effectiveness of SEO campaigns and marketing activity in general. Here are the ones you should really get familiar with.
1. Who are your recipients?
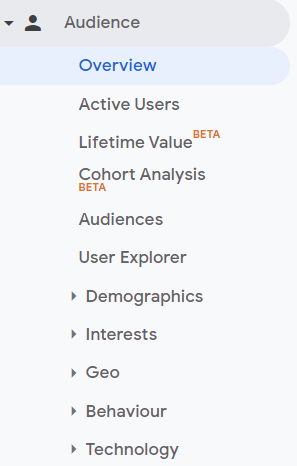
Of course, before you obtain data to analyze, you need to use Google Analytics for several months and your website has to be visited by users. Let’s start with analyzing who your recipients are. To check it, select “audience” from the menu on the left and then click “overview”.
Now, you should see information considering the selected range. The data relates to:
- Users
- New users – meaning people who entered your website for the first time in the selected time range.
- Sessions – users’ activity in the selected time. The default session time is 30 minutes but this length can be changed in Google Analytics. One user can generate multiple sessions in one day. Click here to learn more about web sessions.
- Impressions – the total number of all page impressions in selected time.
- Average web session length – how much time one user spends on average on the page.
- Bounce rate – the percentage of website visits that ended after seeing only one subpage.
Below this data, you can find further information that can tell you a lot about your website visitors:
- Country your website visitors come from.
- City.
- Search engine.
- Operating system.
- Screen resolution (mobile traffic).
Subsequent points in the “audiences” part also provide you with valuable data:
- Demographics – age and gender of visitors.
- Interests – e.g. similarity categories (grouped by user lifestyles) and market segments (grouped by product purchase interests).
- Behavior – you can check, among other things, whether your site is visited mainly by new or returning visitors.
- Technology – from this tab, you’ll find out which browser and operating system is preferred by the users.
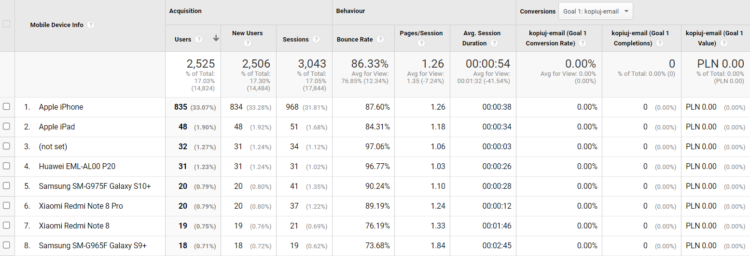
- Mobile traffic – data concerning mobile devices used by your website visitors.
How to benefit from information about your recipients?
If a significant percentage of your website visitors come from abroad, then, it’s worth considering introducing a new language version. The obtained knowledge will also facilitate campaign targeting – once you know your target group, you’re able to efficiently tailor activities to the audience.
Check if your website is displayed well at different resolutions. The high bounce rate of a specific resolution may indicate problems.
2. How do users reach your website?
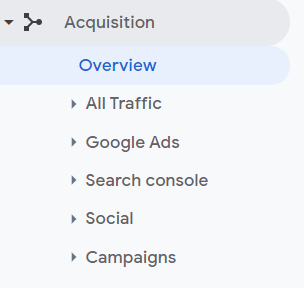
The “acquisition” tab on the left side of the menu is also a valuable source of information.
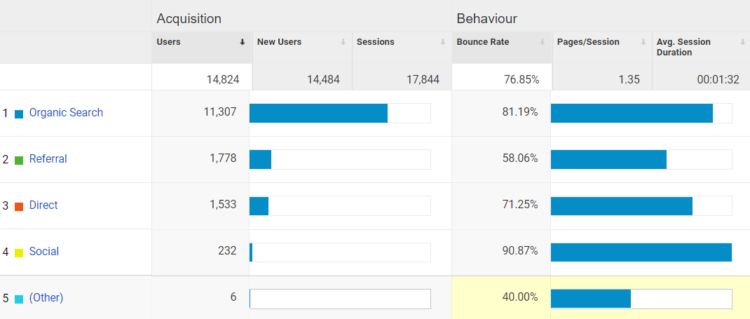
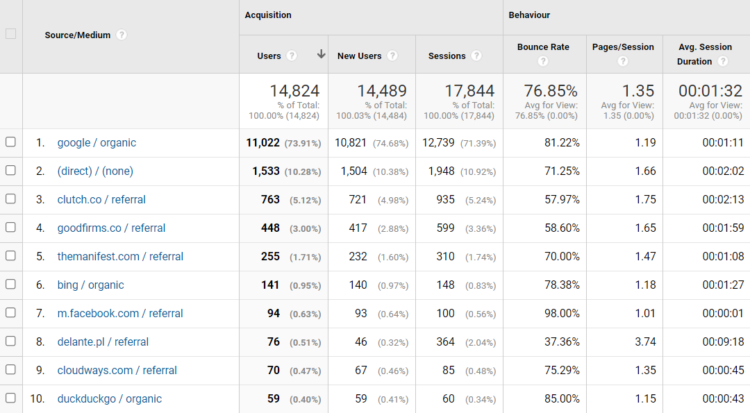
When you click the “overview” section, you’ll see how many website visitors entered your website depending on the source. You’ll also find out how much time on average they spent on your page and what was the bounce rate.
“Organic search” means visits from organic search results, whereas “direct” refers to users who entered your website address into the browser. “Social” indicates visits from social media platforms and “referral” informs about visitors who were redirected to your page after clicking a link on another website. Specific data on particular traffic sources can be found in the “channels” tab. “Source/Medium” will give you an insight into the medium that generated the greatest traffic.
It’s worth linking Google Analytics and Google Ads accounts. Thanks to it, you’ll be able to display Google Ads information on your Analytics dashboard, import data and goals from Analytics to your Google Ads account, or benefit from enhanced remarketing functionalities.
The Analytics account can also be linked to Google Search Console. Thanks to it, you’ll see which search queries led users to your website from Google, which subpages are visited the most frequently or what’s the average phrase position and how high your CTR is.
Why is this data so helpful? Thanks to it, you can assess the effectiveness of marketing activities. Does the social media campaign you invested in translate into greater website traffic? And if so, what’s the effectiveness of this traffic? You can also analyze which mediums have the lowest bounce rate and focus on them. The plus is that it’s possible to have all the data from Google Search Console and Google Ads in one place.
3. What subpages are left without any action?
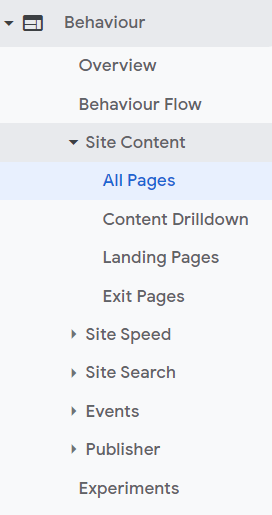
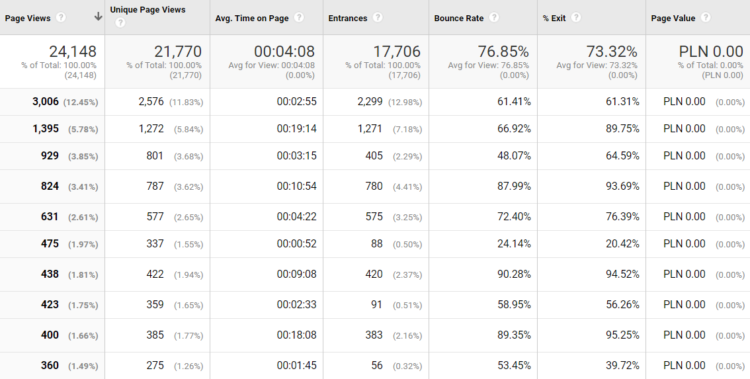
Select “behavior”, “site content” and then “all pages”.
Now, you’ll see a list of all subpages and detailed data about visits. You can sort them according to the highest bounce rate. Pay special attention to subpages with abnormal parameters. Analyze the content of subpages with high and low bounce rates. Draw conclusions. What activities performed on the subpage with the lowest bounce rate did help you achieve such results?
Try to implement changes on subpages with a high bounce rate. Perhaps it’s enough to enrich content with links that might interest users? It’s worth testing available solutions as visitors staying on your website for longer are more likely to become your customers. Learn more about methods of decreasing the bounce rate of an online store.
4. What’s your conversion customer journey map?
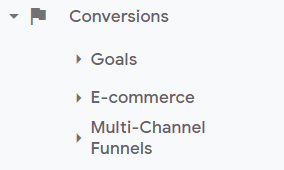
Imagine that users enter your website, get acquainted with your offer, and order products or services. That’s a perfect scenario. Unfortunately, it doesn’t happen frequently, however, you still should try your best to have as high conversion as possible. Google Analytics can help you improve your results. How? Start with selecting “conversions” and then “goals” from the menu on the left.
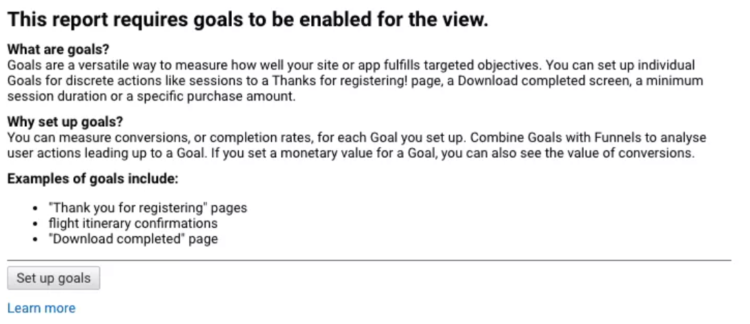
If you’ve never tried determining your goals before, check out the following message:
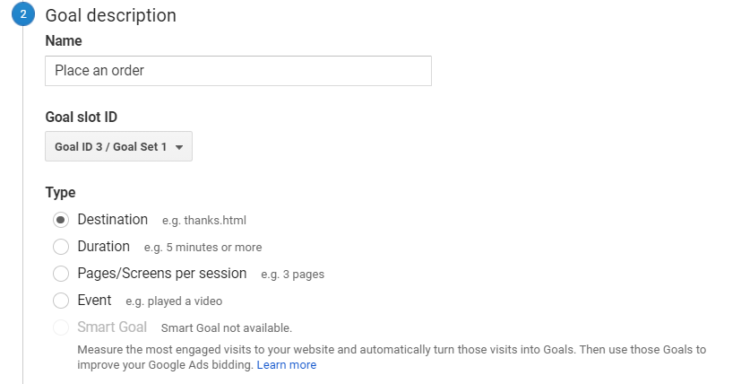
Click “select goals” and choose the red button “+goal”.
Choose goals you want to accomplish. You can go for a ready-made template or select your own, custom one. Test available solutions. For example, choose “e-commerce” and describe your objective in detail.
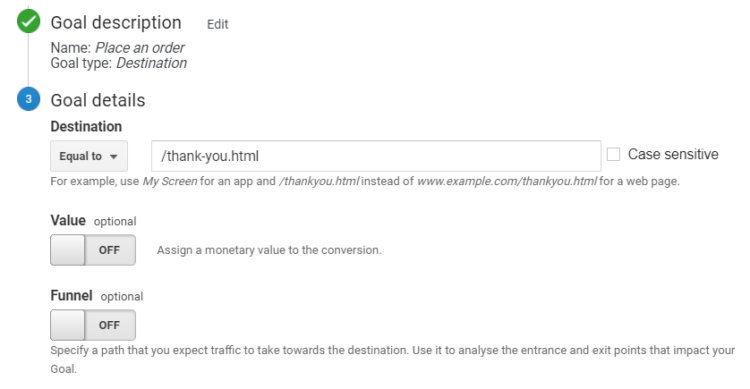
Apart from other things, you can select a destination, meaning the page, such as “thank you.html”, that will be displayed to users who finalize orders.
Save the selected functionalities and see whether everything has been done properly. Just complete the goal yourself to check if the report contains relevant data. You can do this by selecting “conversions” and then “goals” and “overview”. Decide if you want to see statistics concerning all goals or only a specific one.
It’s also possible to verify the conversion path – check out the “multi-channel funnels” report. There, you’ll see the main conversion paths and find out which of them are chosen the most frequently. What’s important, you can access the record of the entire path, from the first-page visit to the completion of the goal. The “path length” report will inform you about the number of subpages visited by users before they made a conversion.
5. What subpages are usually visited as the first ones?
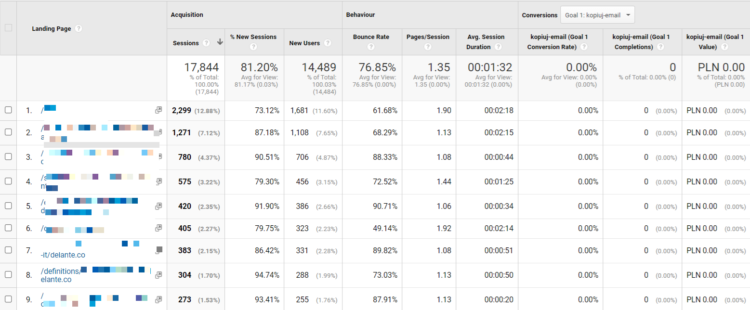
To obtain this information, enter the “behavior”, “overview”, “website content” and finally “landing pages” tabs.
From the report, you’ll find out where users start browsing your website. Why do you need this information? You should focus on subpages visited as the first ones as much as possible to ensure that visitors stay on your website. If this part of the site isn’t refined and disappoints users, they’ll probably leave the page. A high bounce rate means that there’s a lot to work on.
6. What do users search for on your website?
Almost every website makes it possible to check what visitors tried to access with the use of the internal search engine. How to analyze it? Enter the “behavior”, “site search” and “overview” tabs.
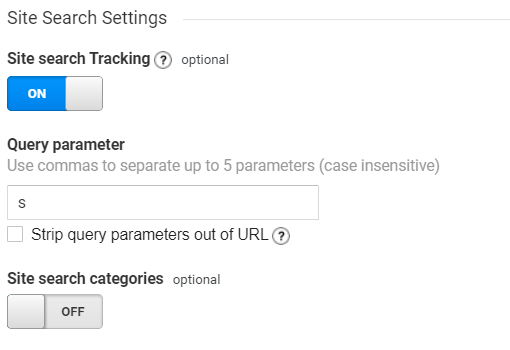
However, to see data there, first, you have to configure the report. Click “admin”, “view settings” and enable “site search settings”. Enter the appropriate search parameter. Where to get it from? Go to your website and use the search engine. There, you’ll see the address of the page the search results are displayed on. The parameter you need is a character between “?” and “=”. Below it’s an “s”, but it could also be “query” or any other word.
Once everything is configured, you should see the following modifications:
Click “save.” After a few hours or days, go back to the “site search” report and see what data you have there. How to benefit from it? Maybe users are searching for something that’s not in your offer? If they didn’t find it, they probably left the page. Enrich your website with appropriate content or products that will attract the attention of your potential customers for longer.
7. What social media campaigns generated the greatest traffic?
If you invest in any campaigns, you probably want them to be effective. So how to evaluate which activities bring the greatest results? Google Analytics is helpful also this time. To gain knowledge in this area, benefit from UTM parameters added to URLs. When a user clicks on a link with a UTM parameter, GA notes this fact. You can use 5 UTM tags such as:
- utm_campaign – campaign name, e.g. http://websiteaddress.com/? utm_campaign=someaction,
- utm_source – source, e.g. http://websiteaddress.com/?utm_source=instagram,
- utm_medium – for group sources, e.g. http://websiteaddress.com/?utm_medium=refferal,
- utm_content – for monitoring a specific part of the campaign from a given destination,
- utm_term – for tracking paid search results based on keywords.
You can combine UTMs, so that your URL may look like this: http://yourwebsite.com/?utm_source=instagram&utm_medium=social&utm_campaign=someactivity.
To easily prepare URLs, benefit from Campaign URL Builder. A link like that can be used during your campaign to measure its effectiveness.
In order to review the collected data, log into your GA account, select “acquisition” and “overview”. Based on that, you can draw conclusions concerning the effectiveness of performed activities – you’ll learn which actions are worth investing in and which require some modifications.
8. What CTA is the most effective?
You’ve probably applied CTAs on your website, but do you monitor their effectiveness? Are you sure that specific content or button is located in the finest place on your page? GA will help you also this time. Select “behavior” and then “events”. However, to see the data, first, you need to determine what type of events you want to analyze.
Add a GA event (‘send’, ‘event’, [Category], [Action], [Label], [Value]) to the HTML code of each element you want to measure. “Category” and “action” are mandatory parameters and the remaining 2 are optional. In the case of “category”, mark the group of objects you wish to monitor. This aims at specifying what actions were performed by the user. “Label” characterizes the event more accurately and “value” determines its importance.
Now add an appropriate code to your CTA. Let’s assume that your code looks in the following way:
After adding the event code, it’ll look as follows:
The “Link1” and “10” items aren’t obligatory. Go back to Google Analytics after adding this code to the page. Click “behavior,” “events,” and “overview.” There you should find information on the number of clicks on particular CTAs. You can modify parameters after some time to see which option is the most effective.
As you can see, GA provides a great variety of possibilities when it comes to data analysis. Use them to your advantage to draw conclusions and run more and more effective marketing campaigns.






“Google analytics” is an amazing tool that I’ve been using the past 8 years and I never regret using it. It allows you to track and understand your customer’s behavior, user experience, online content, device functionality and more.
I’m wondering if there will ever be a website analytical tool that will beat GA in terms of availability. It’s now hard to imagine that there were times Google Analytics was not so developed or even didn’t exist 😀